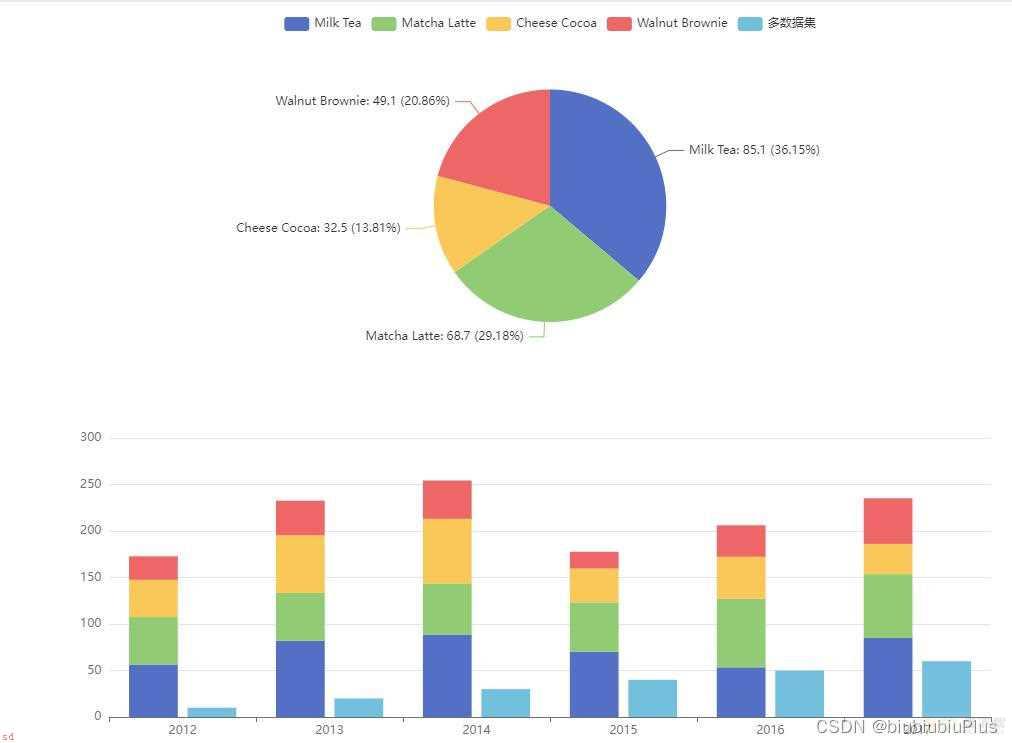
Echarts联动和共享数据集,多个数据集时的处理
作者:快盘下载 人气:33
echarts【联动和共享数据集】
☆多数据集的处理
setTimeout(function () { option = { legend: {}, tooltip: { trigger: ;axis;, showContent: false }, dataset: [{ source: [ [;product;, ;2012;, ;2013;, ;2014;, ;2015;, ;2016;, ;2017;], [;Milk Tea;, 56.5, 82.1, 88.7, 70.1, 53.4, 85.1], [;Matcha Latte;, 51.1, 51.4, 55.1, 53.3, 73.8, 68.7], [;Cheese Cocoa;, 40.1, 62.2, 69.5, 36.4, 45.2, 32.5], [;Walnut Brownie;, 25.2, 37.1, 41.2, 18, 33.9, 49.1], ] },{ source: [ [;product;, ;2012;, ;2013;, ;2014;, ;2015;, ;2016;, ;2017;], [;多数据集;, 10, 20, 30, 40, 50, 60], ] }], xAxis: { type: ;category; }, yAxis: { gridIndex: 0 }, grid: { top: ;55% }, series: [ { type: ;bar;, smooth: true, stack: ;Ad;, seriesLayoutBy: ;row;, datasetIndex: 0 }, { type: ;bar;, smooth: true, stack: ;Ad;, seriesLayoutBy: ;row;, datasetIndex: 0 }, { type: ;bar;, smooth: true, stack: ;Ad;, seriesLayoutBy: ;row;, datasetIndex: 0 }, { type: ;bar;, smooth: true, stack: ;Ad;, seriesLayoutBy: ;row;, datasetIndex: 0 }, { type: ;bar;, smooth: true, seriesLayoutBy: ;row;, datasetIndex: 1 }, { type: ;pie;, id: ;pie;, radius: ;30%, center: [;50%, ;25%], label: { formatter: ;{b}: {;2012} ({d}%); }, encode: { itemName: ;product;, value: ;2012;, tooltip: ;2012; } } ] }; myChart.on(;updateAxisPointer;, function (event) { const xAxisInfo = event.axesInfo[0]; if (xAxisInfo) { const dimension = xAxisInfo.value ; 1; myChart.setOption({ series: { id: ;pie;, label: { formatter: ;{b}: {;[; ; dimension ; ;]} ({d}%); }, encode: { value: dimension, tooltip: dimension } } }); } }); myChart.setOption(option); });
加载全部内容