zabbix企业级监控之监控数据库常见问题
作者:快盘下载 人气:152zabbix是一款强大的分布式监控系统,集各家所长于一体,得到了广大SA的认可。其强大的管理界面也极其方便,但是美中不足的是,如果同时有大批量(50台+)的服务器需要添加监控时,这时,其图形界面反而显得有些臃肿了,好在zabbix提供了一套强大的API管理接口,我们可以使用它快速地添加或删除成千上万台服务器了。
怎么去获取到数据库大小、表大小?
information_schema数据库存储了关于数据库的信息

使用information_schema数据库
MariaDB [(none)]> use information_schema ;查询数据库总大小
MariaDB [information_schema]> select concat(round(sum(data_length/1024/1024),2),'MB') as data from tables;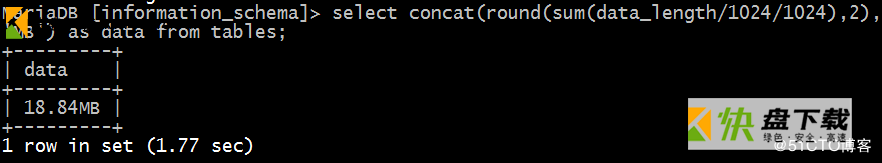
查询指定数据库zabbix的大小
MariaDB [information_schema]> select concat(round(sum(data_length/1024/1024),2),'MB') as data from tables where table_schema='zabbix';
查询指定数据库的指定表的大小(zabbix数据库的items表的大小)
select concat(round(sum(data_length/1024/1024),2),'MB') as data from tables where table_schema='zabbix' and table_name='items';
2.如何通过shell 脚本去获取?
vim /etc/zabbix/shell/monitor_mysql.sh
#!/bin/bash DB_size() { mysql -Dinformation_schema -e "select concat(round(sum(data_length/1024/1024),2)) as data from tables" |awk 'NR==2{print $1}' } DB_zabbix_size() { mysql -Dinformation_schema -e "select concat(round(sum(data_length/1024/1024),2)) as data from tables where table_schema='zabbix'" | awk 'NR==2{print $1}' } $1
3.agent定义模板
vim userparameter_my.conf
UserParameter=monitor_mysql[*],/bin/bash /etc/zabbix/shell/monitor_mysql.sh "$1"参数解释:
monitor_mysql[]:是自定义key,是传参 是从server端自定义键值的时候传参传下来的
4.server端自定义键值,请参考第二篇,监控QPS和TPS的那篇
5.准备更新一个关于zabbix监控的专题,欢迎加入我们的Linux技术交流群:642921645,zabbix监控交流群:832462735 ,我们不定期去更新很多关于系统运维的资料在群里,期待你的加入!
6.在腾讯课堂有zabbix监控的免费技术分享,欢迎来听!地址如下:https://ke.QQ.com/course/316681?tuin=6645db32
加载全部内容