wireshark安装教程_weblogic12.2.1.3下载
作者:快盘下载 人气:29环境架构
windows 客户端负责采集转发
centos 服务端负责展示
winlogbeat 优点就是轻量级,因为去掉了笨重的logstash, 占用资源更少。
软件地址
Elasticsearch 下载:https://www.elastic.co/downloads/elasticsearch Logstash 下载:https://www.elastic.co/downloads/logstash kibana 下载:https://www.elastic.co/downloads/kibana winlogbeat 下载:https://www.elastic.co/cn/downloads/past-releases#winlogbeat
安装时需要保证,组件版本一致。
安装ES
wget https://artifacts.elastic.co/downloads/elasticsearch/elasticsearch-7.6.2-x86_64.rpm rpm -ivh elasticsearch-7.6.2-x86_64.rpm
vim /etc/elasticsearch/elasticsearch.yml
添加如下三行:
network.host: 0.0.0.0 http.port: 9200 discovery.seed_hosts: ["0.0.0.0"]
否则启动时日志会报错:
tail -f /var/log/elasticsearch/elasticsearch.log
[controller] the default discovery settings are unsuitable for production use; at least one of [discovery.seed_hosts, discovery.seed_providers, cluster.initial_master_nodes] must be configured启动:
systemctl daemon-reload systemctl status elasticsearch.service service elasticsearch start
排查启动报错的方法:
journalctl -xe或
vim /var/log/elasticsearch/elasticsearch.log安装kibana
wget https://artifacts.elastic.co/downloads/kibana/kibana-7.6.2-x86_64.rpm rpm -ivh kibana-7.6.2-x86_64.rpm
vim /etc/kibana/kibana.yml
添加如下四行:
server.port: 5601 server.host: "0.0.0.0" elasticsearch.hosts: ["http://localhost:9200"] logging.dest: /var/log/kibana/kibana.log
启动:
systemctl start kibana systemctl status kibana
查看进程:
[root@controller ~]# netstat -ntlp|grep -E "9200|9300|5601" tcp 0 0 0.0.0.0:5601 0.0.0.0:* LISTEN 4962/node tcp6 0 0 :::9200 :::* LISTEN 5023/java tcp6 0 0 :::9300 :::* LISTEN 5023/java
安装winlogbeat
https://artifacts.elastic.co/downloads/beats/winlogbeat/winlogbeat-7.6.2-windows-x86_64.zip修改 winlogbeat.yml:
#============================== Kibana ===================================== setup.kibana: host: "10.10.40.63:5601" #-------------------------- Elasticsearch output ------------------------------ output.elasticsearch: # Array of hosts to connect to. hosts: ["10.10.40.63:9200"]
管理员登录powershell:
安装服务:
PowerShell.exe -ExecutionPolicy UnRestricted -File .install-service-winlogbeat.ps1运行测试命令检查是否出错:
.winlogbeat.exe test config -c .winlogbeat.yml -e报错:
index [XXX] blocked by: [FORBIDDEN/12/index read-only / allow delete (api)]原因为磁盘空间空间不足,当Elasticsearch运行时检测到磁盘空间超过了95%,为了防止节点耗尽磁盘空间,自动将索引设置为只读模式
打开Elasticsearch目录下的configelasticsearch.yml,添加
cluster.routing.allocation.disk.watermark.flood_stage: 99%或
cluster.routing.allocation.disk.threshold_enabled: false是索引只有只读和删除权限,将所有的索引设为非只读删除权限:
curl -XPUT -H 'Content-Type: application/json' http://127.0.0.1:9200/_all/_settings -d '{ "index" : { "blocks":{ "read_only_allow_delete":"false"}}}'
清理cache:
echo 1 > /proc/sys/vm/drop_caches启动服务:
net start winlogbeat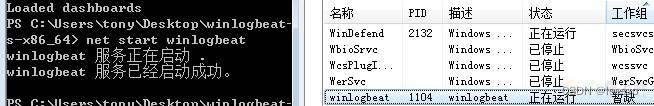
在kibana 查看日志:
首页-Descover
联动win 原生日志转发监控
转发win 事件查看器 “转发事件” 日志到ES:
winlogbeat.event_logs: - name: ForwardedEvents
https://www.elastic.co/guide/en/beats/winlogbeat/7.6/winlogbeat-modules.html
win 原生日志的转发监控请参考我上一篇博文:windows日志转发_leeezp的博客-CSDN博客_windows日志转发
reference
https://blog.csdn.net/weixin_37450409/article/details/121362037
后记
如果想给转发的事件日志打一个整体的tag,可以这样配置:
winlogbeat.event_logs: - name: ForwardedEvents tags: ["10.10.40.50","AD"]

版权声明:本文内容由互联网用户自发贡献,该文观点仅代表作者本人。本站仅提供信息存储空间服务,不拥有所有权,不承担相关法律责任。如发现本站有涉嫌侵权/违法违规的内容, 请发送邮件至 举报,一经查实,本站将立刻删除。
发布者:全栈程序员栈长,转载请注明出处:https://javaforall.cn/181610.html原文链接:https://javaforall.cn
加载全部内容